The easiest way to get started is by using our simple "Starter Example". There is a version of this same example for each type of analysis in the software. We recommend you start with the Basic Analysis.
The easiest way to find the starter example is using the ribbon as shown in the image below:
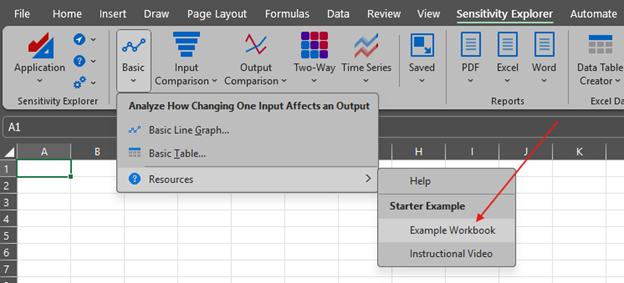
Click the Example Workbook menu item to open the file, which is a very simple business growth model.
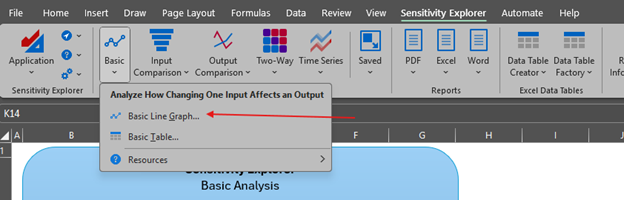
Now click the Basic Line Graph command on the ribbon as shown here:
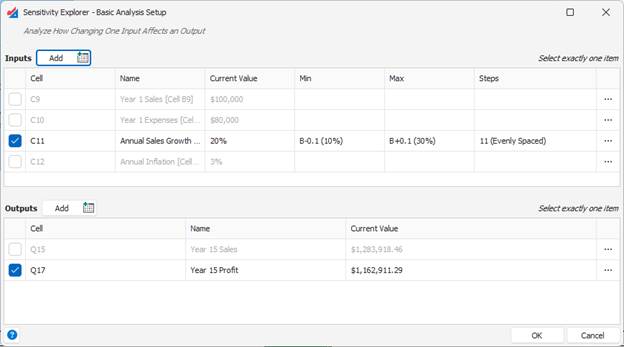
This will show a dialog window where you can specify the input and output you want to analyze. The starter example already has these selected for you, but feel free to choose different ones, or change their parameters:
Finally, when you click the OK button, the analysis is performed, and you see the sensitivity analysis results in a window:
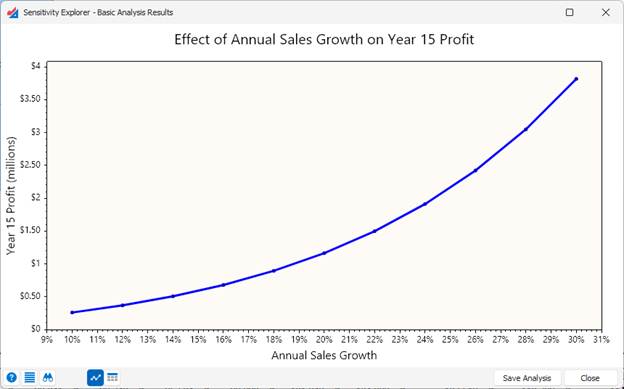
Congratulations! You’ve now run your first sensitivity analysis.
Was this article helpful?
That’s Great!
Thank you for your feedback
Sorry! We couldn't be helpful
Thank you for your feedback
Feedback sent
We appreciate your effort and will try to fix the article